With the incredible uptick in oil and gas exploration in recent years, the U.S. has seen a lot of changes to the landscape in regions across the country. The introduction and wide-spread use of hydraulic fracturing—commonly called fracking—means that basins and reservoirs that were long since considered depleted are now being revisited for new exploration and production.
Given the pace and scope of exploration, energy producers, investors, and watchdogs alike feel the need for better information and reporting. People want to know when and where oil and gas exploration is taking place. Using satellite imagery, we can detect and monitor this activity more easily and more frequently than on-the-ground reporting. Using imagery from our partners at Planet, CrowdAI’s deep learning algorithms can identify well pads and can differentiate between pads with varying levels of activity.
Well pads—where drilling and fracking activity takes place—require time, land, and resources to create and maintain. Certain types of equipment need to be present for fracking to take place, and we can train a deep learning algorithm to search for that equipment. In addition, there are a number of regulations in place for the safety of workers, nearby residents, and the environment. We can monitor well pads for compliance with those requirements, such as keeping the well pad clear of vegetation.
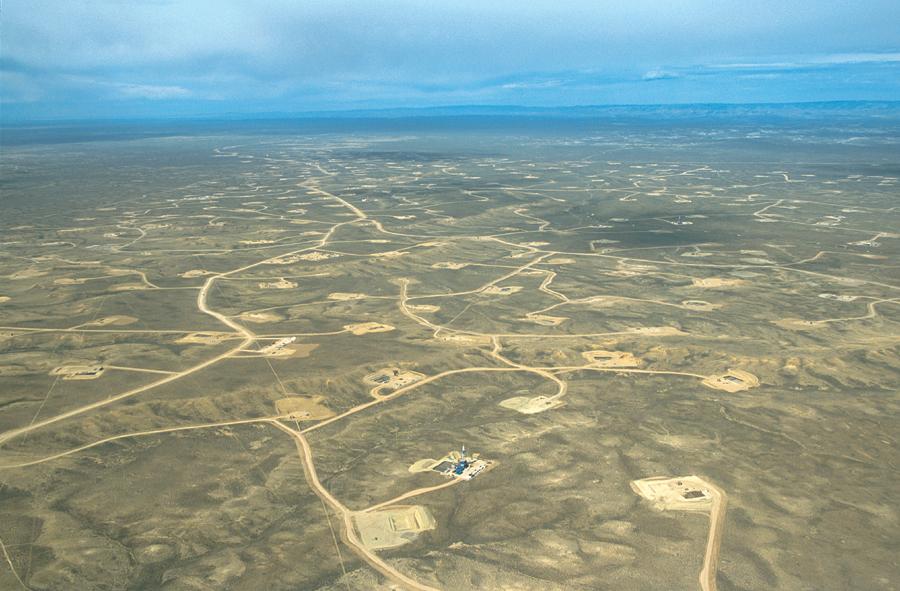
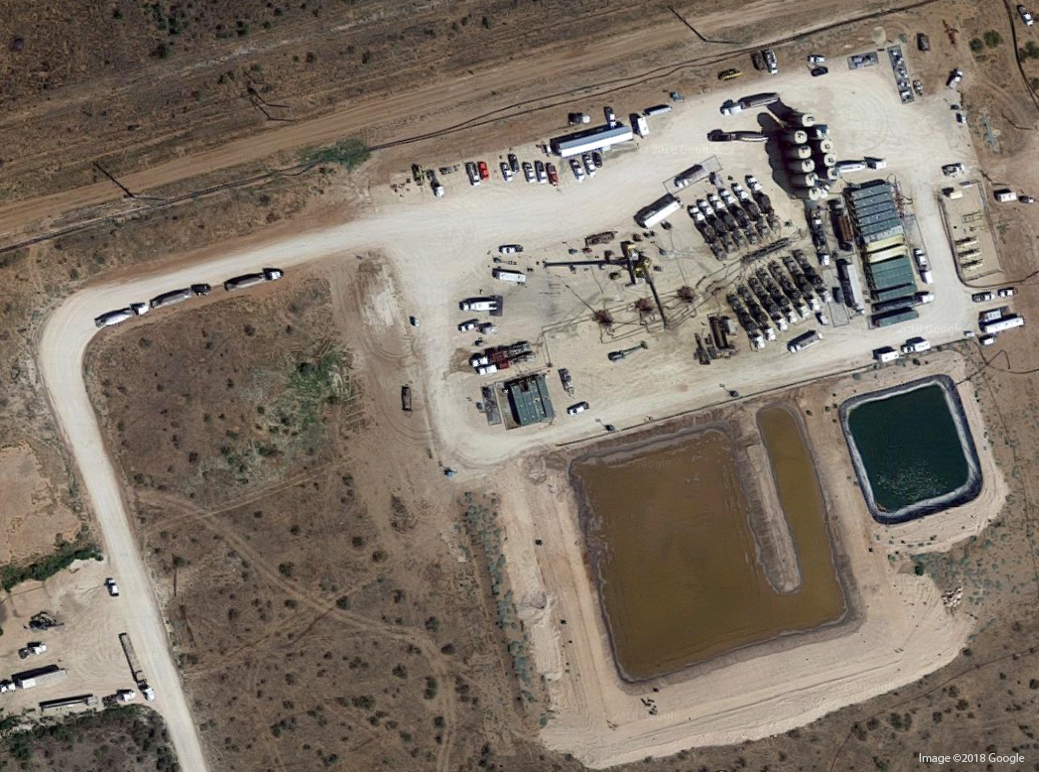
When fracking is taking place, there’s a whole lot of activity on the well pad. This aerial image is great for seeing everything in high detail. This image from the Permian Basin is a classic example of fracking: the containers, pump trucks, lines, and water wells are all present.
But aerial imagery can be difficult to get over a large area on a frequent basis. That’s why we trained our well pad detector to pick out the thousands of well pads across entire drilling regions from satellite imagery. Now that we know what to look for on a well pad, we can teach the deep learning algorithms to do the same (only much faster).
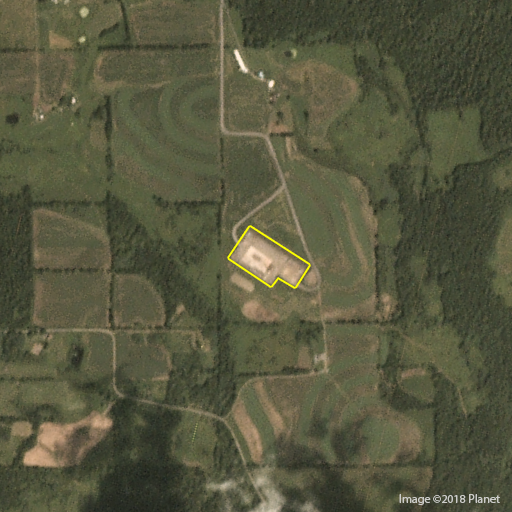
Here’s an example of one well pad from Pennsylvania, where we tracked several hundred pads over the course of several weeks.
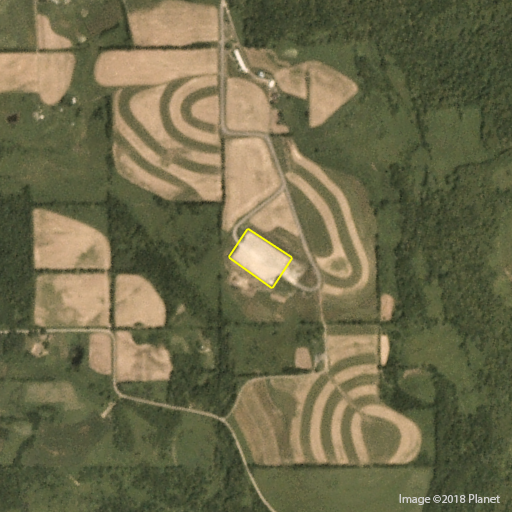
Week 1: Someone’s definitely made a well pad here, but there’s nothing on it. Our model classifies this as a well pad with no activity.
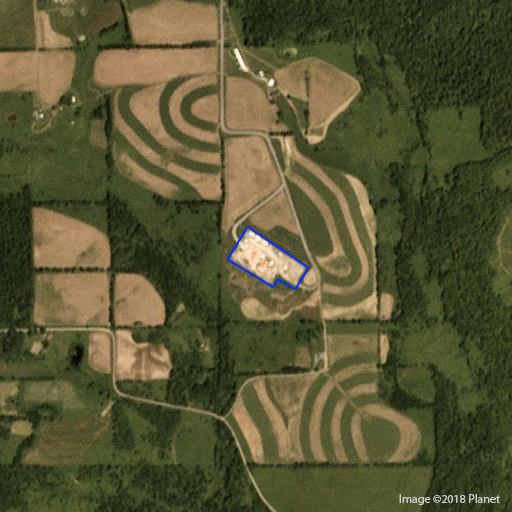
Week 2: What a difference a week can make! The formerly desolate pad is now brimming with activity. We can see shapes of different colors and reflectivity, which gives us an understanding of what type of equipment is present. The shape of the pad has changed, too, as a square in the top-right was cleared out. Looks like something’s going to happen soon.
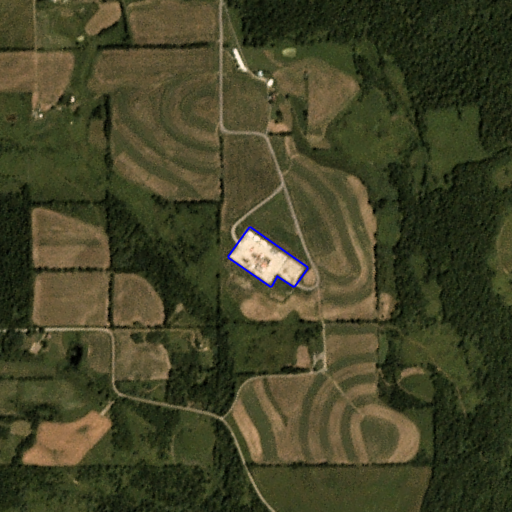
Week 3: The activity on the pad has become more structured than the previous week. We see the concentration of activity in the center of the pad, with other equipment lined up neatly around the perimeter.
Week 4: And just like that, the activity is done. The equipment has been cleared off and the pad is back in a low/no activity state. If fracking was successful here, this pad may move into a long-term production state; if not, the pad may be abandoned over time according to certain protocols.
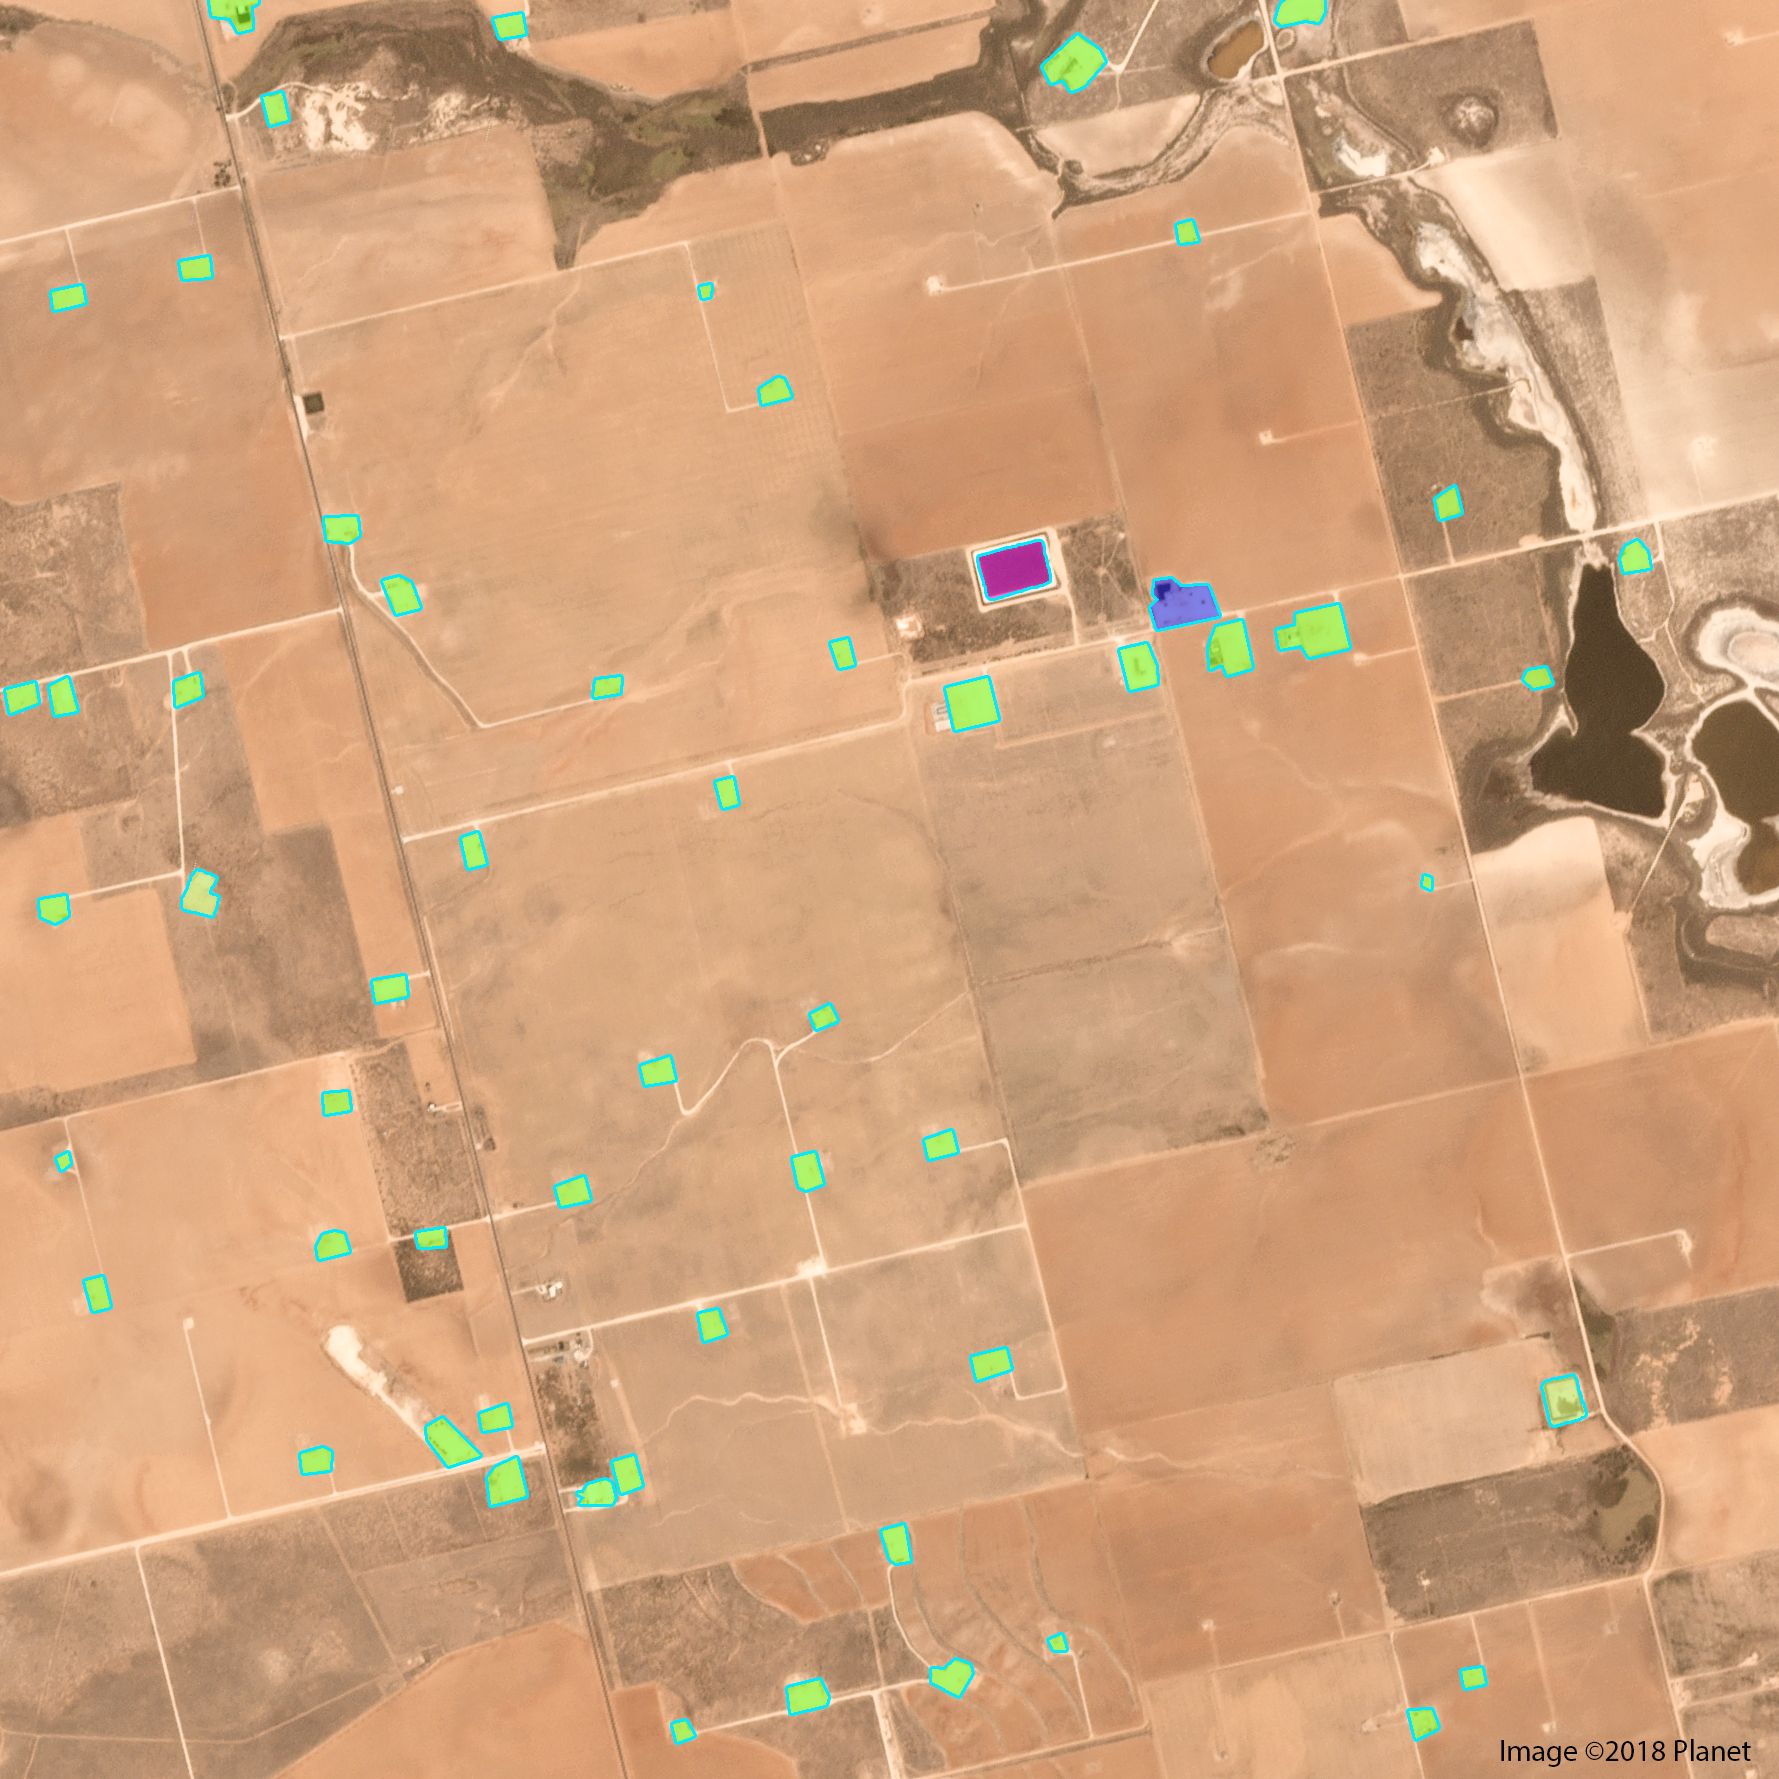
This is just one example. When we expand our algorithm to entire counties or regions, we can get a much clearer understanding of what activity is taking place and how that might impact the area, making these types of operation a lot easier to understand at scale. Below, blue boxes denote pads with high activity, green ones are low/no activity, and pink denotes water.
Want to talk well pads and fracking? Send me a note at cliff@crowdai.com.