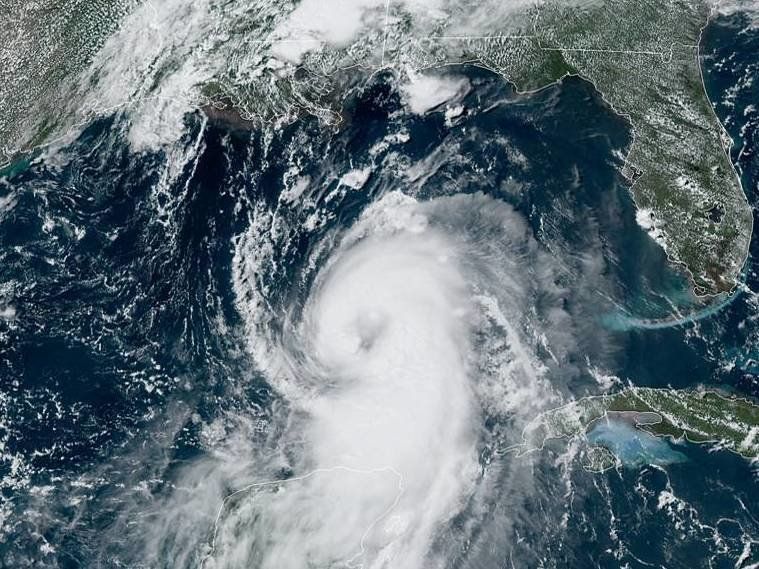
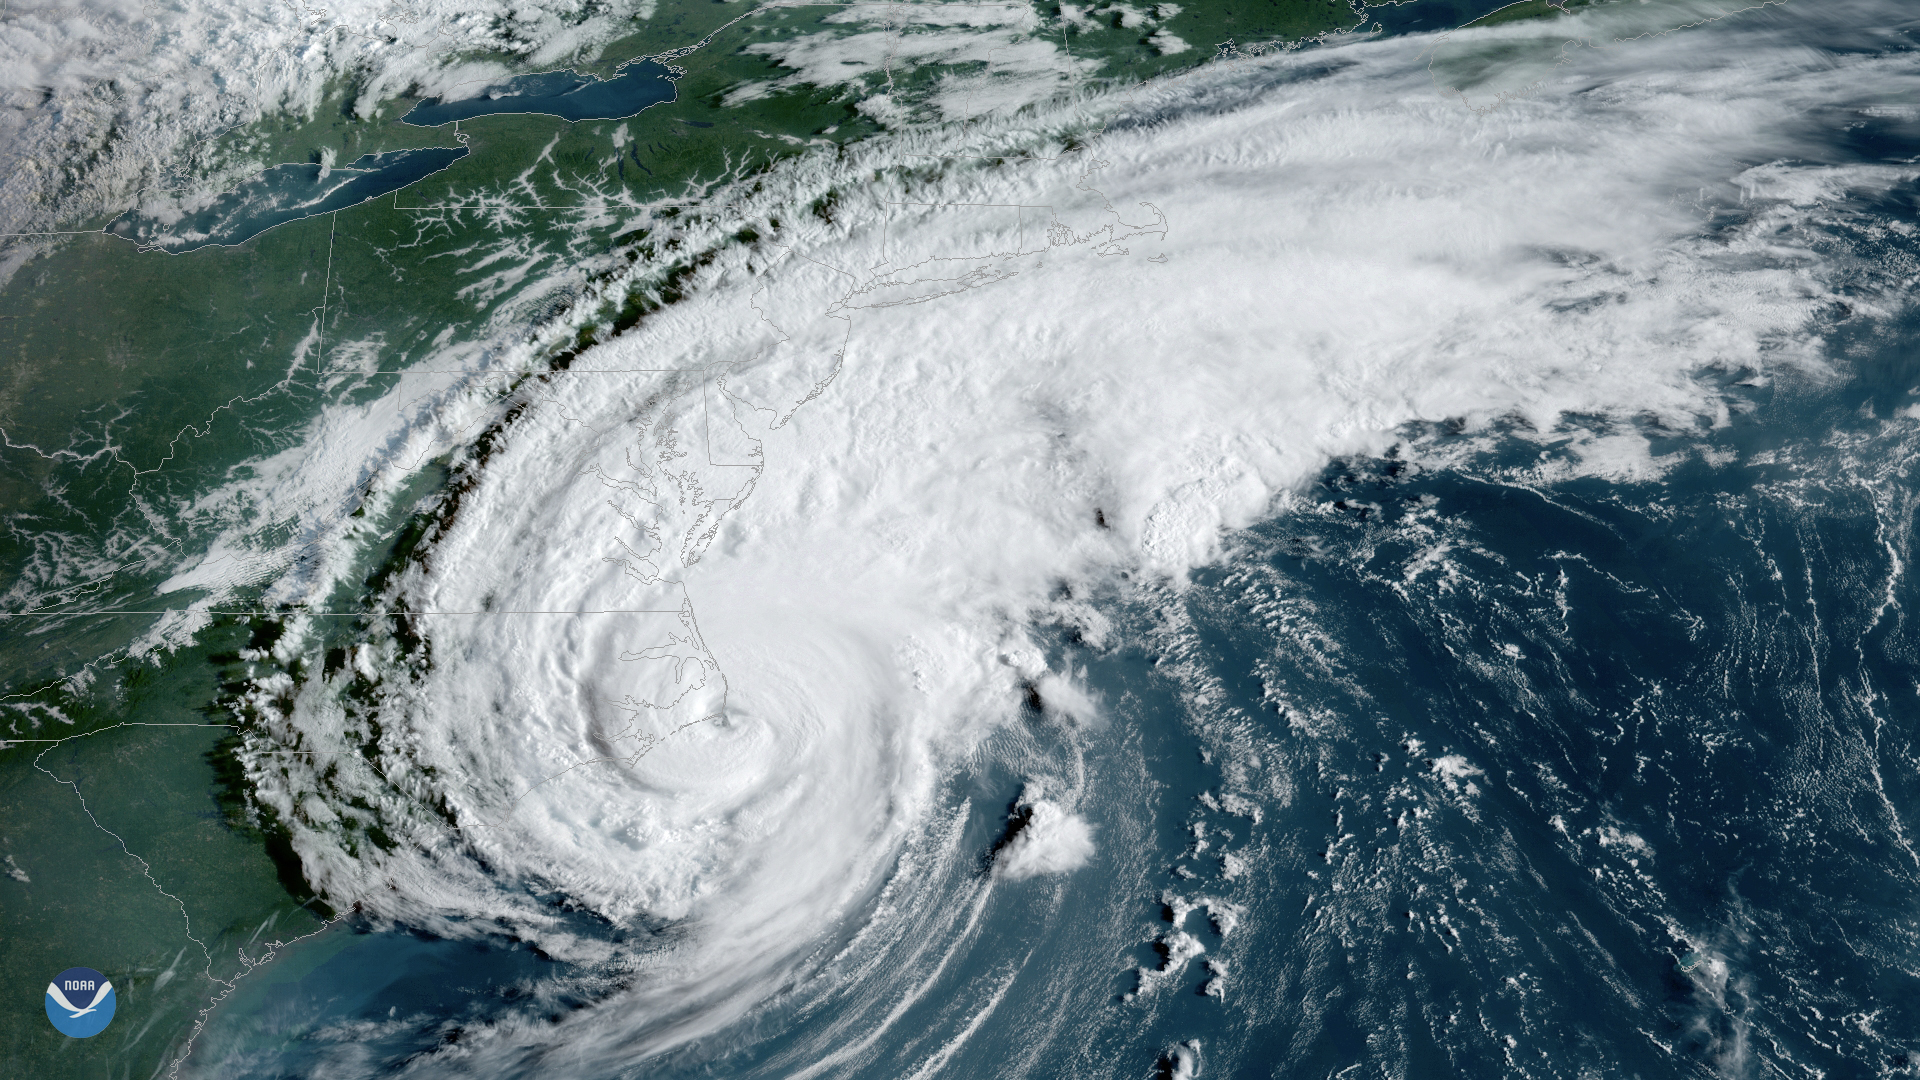
Hurricane Dorian formed on August 24, 2019, wreaking havoc on hundreds of thousands of people—from the Carribean all the way to Canada. The Bahamas experienced catastrophic damage when Dorian made landfall as a Category 5 storm. By the time Dorian reached landfall in Cape Hatteras, NC it was downgraded to a Category 1. However, even at a lower strength, significant damage was done, especially to a 12-mile stretch of Ocracoke, NC. Storm surge reached seven feet, flooding roads and buildings. The residents of Ocracoke were in disbelief at the speed at which the water flooded the island - even in areas that historically had never flooded before.
Hurricane Dorian is not an isolated incident. The losses from storms continue to rise as a result of their increased severity, compounded by the increase in population in the path of storms. There is more data than ever before about the impact storms like Dorian have on homes and infrastructure, and it presents a unique opportunity for artificial intelligence to help make sense of it all.
Within 24 hours after Hurricane Dorian passed, NOAA (in coordination with FEMA and other state and federal partners) collected thousands of aerial images of the Atlantic coast, covering over 3,000 miles. As soon as imagery from NOAA became available over the Outer Banks of North Carolina, the team at CrowdAI went to work deploying our deep learning models to understand the damage done by the storm. We focused on flooding, especially as it relates to roads and buildings.
Road Damage
Flooded roads can be a big problem after a storm. Being able to move people and resources from one area to another is critical for first responders, insurers, and homeowners alike.
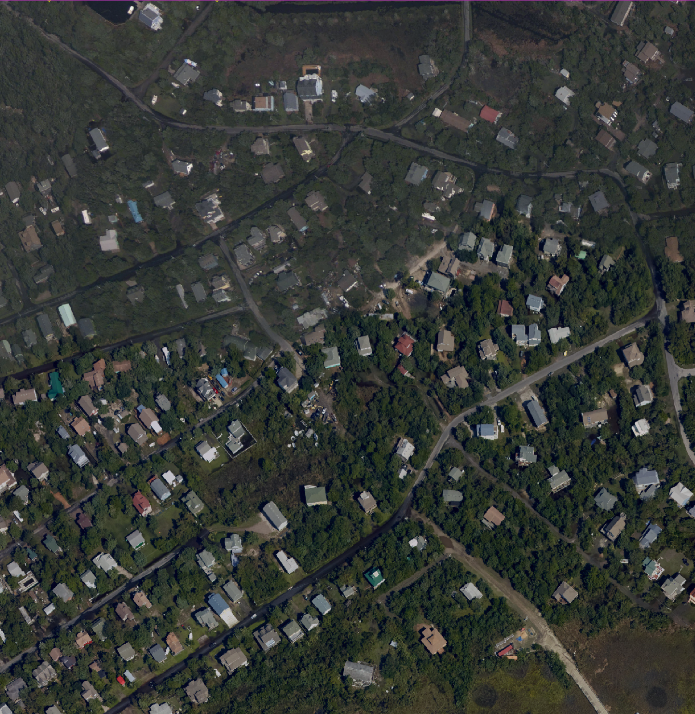
In this area of Ocracoke, some roads remain flooded, while others are passable. While we cannot measure the depth of the water from this type of imagery, our models can be trained to identify only the roads in the image and determine if water is present, which could create a hazard.
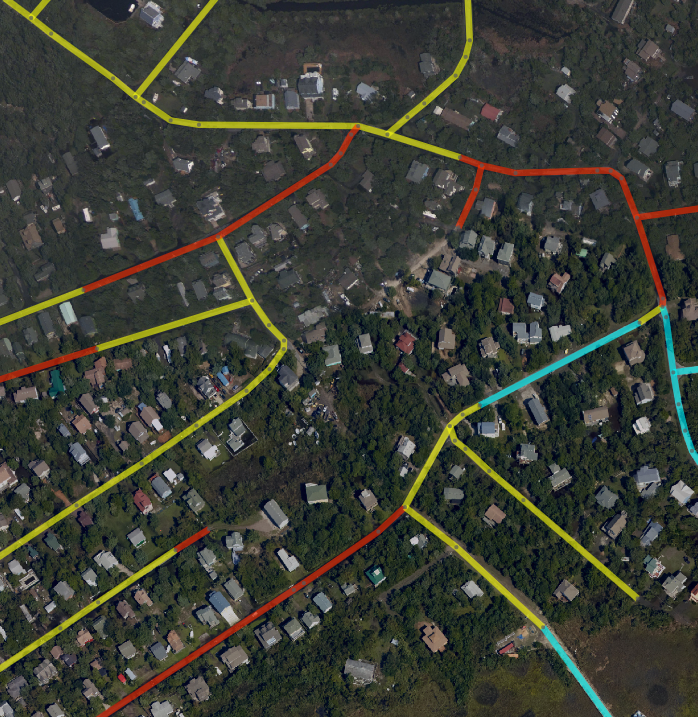
Red roads are completely flooded, while yellow roads are partially flooded. Blue roads seem to be completely dry, and therefore navigable without issue. Because we use an image segmentation approach, we can categorize individual segments of each street in this manner, so it’s possible to tell which particular section of Maple Street is flooded, for example.
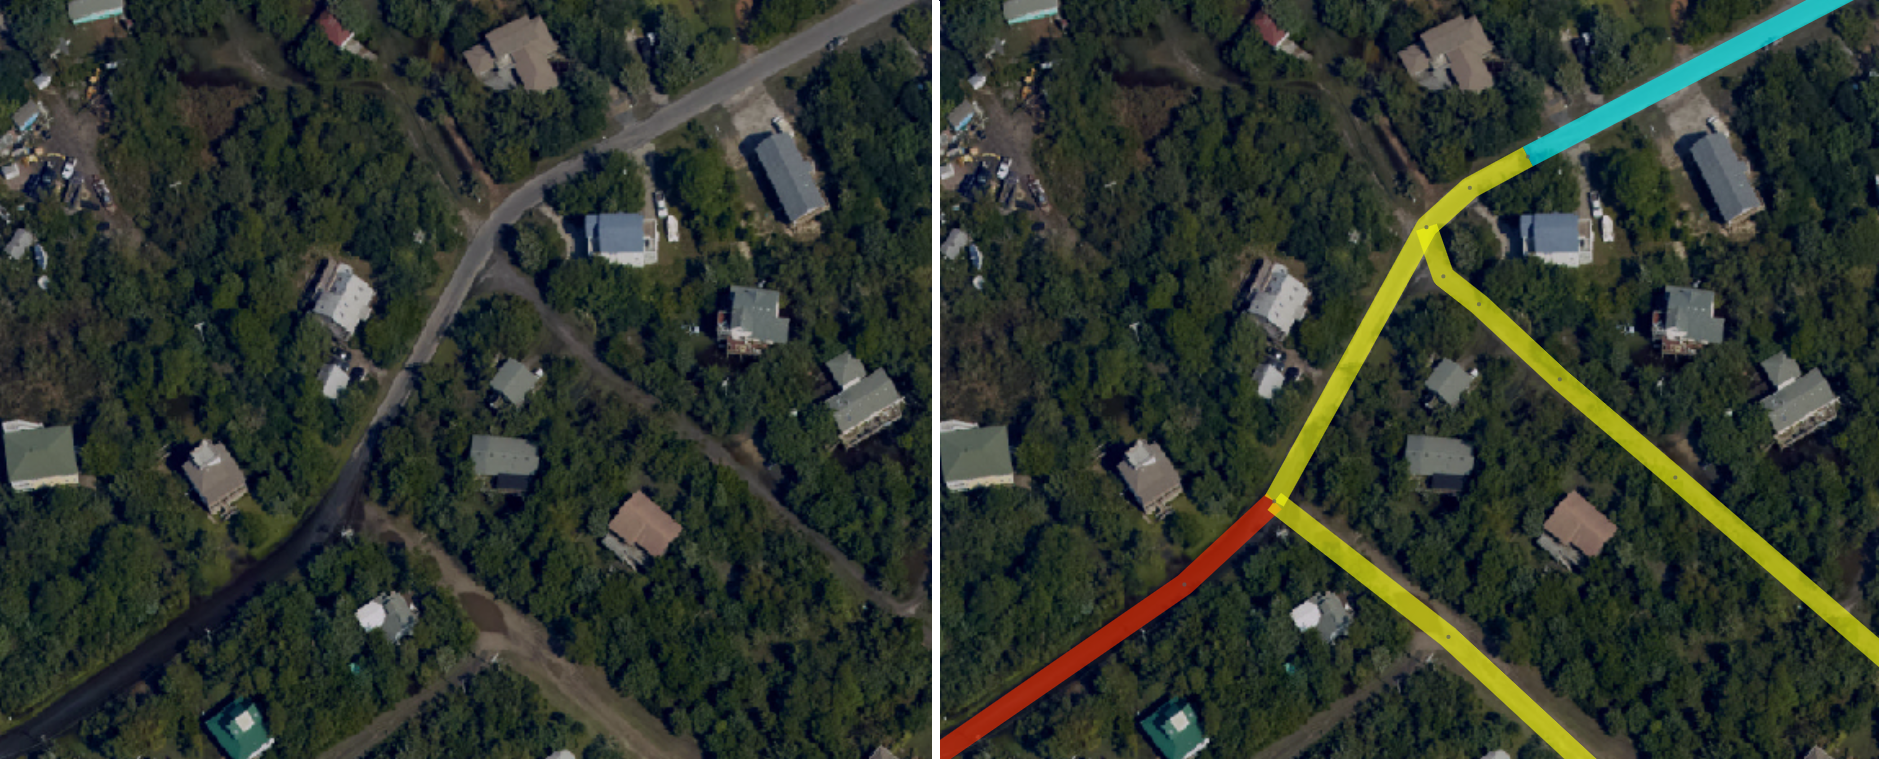
A closer look at a street segment in Ocracoke:
Building Damage
Flood waters can do a great deal of damage to a building, applying pressure to its sides and saturating the ground beneath and around the foundation. If not identified and addressed, flood damage has the value to undermine the structural integrity of a building, an effect that might not be felt for years.
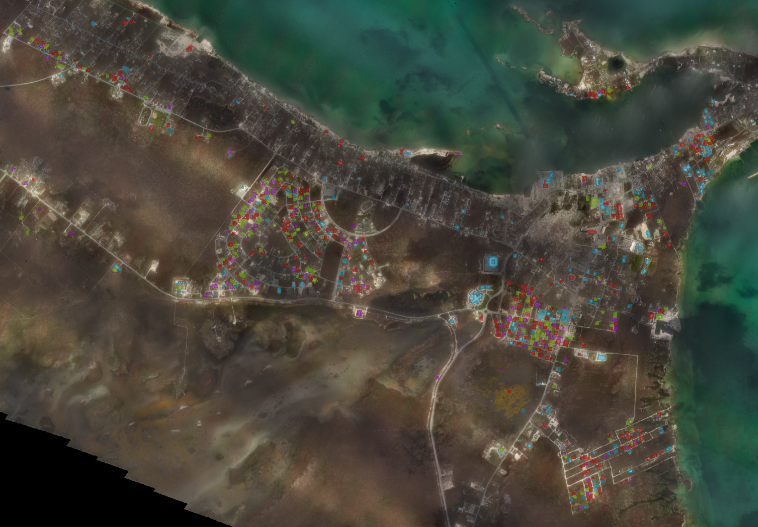
To help understand where the most building damage might have occurred, we identified water on land surface across the NOAA imagery, ruling out areas of “known” water, such as lakes and wetlands. We then grouped together water where it shouldn't be into tight polygons, which generally approximate areas of flooding. By overlaying these “flood water” polygons with building locations, we can get a sense of which buildings are adjacent to water on one or more sides—this indicates a strong likelihood of flooding.
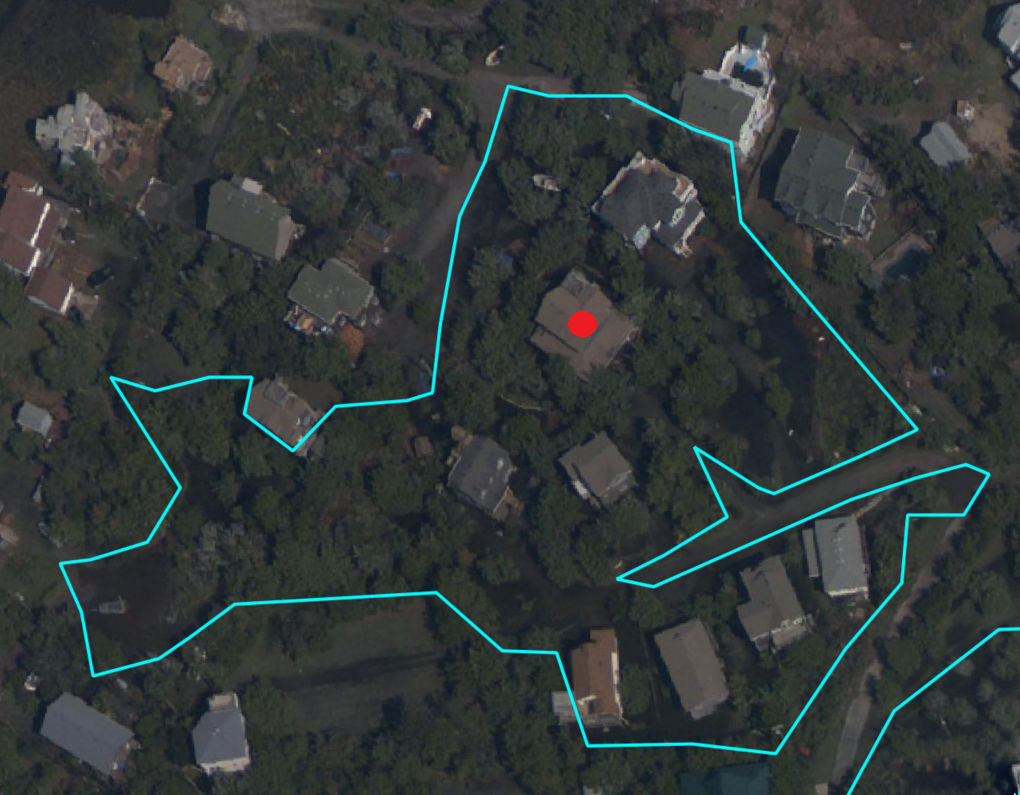
Individual buildings can be surrounded on multiple sides by water, indicating a strong likelihood of flood damage.
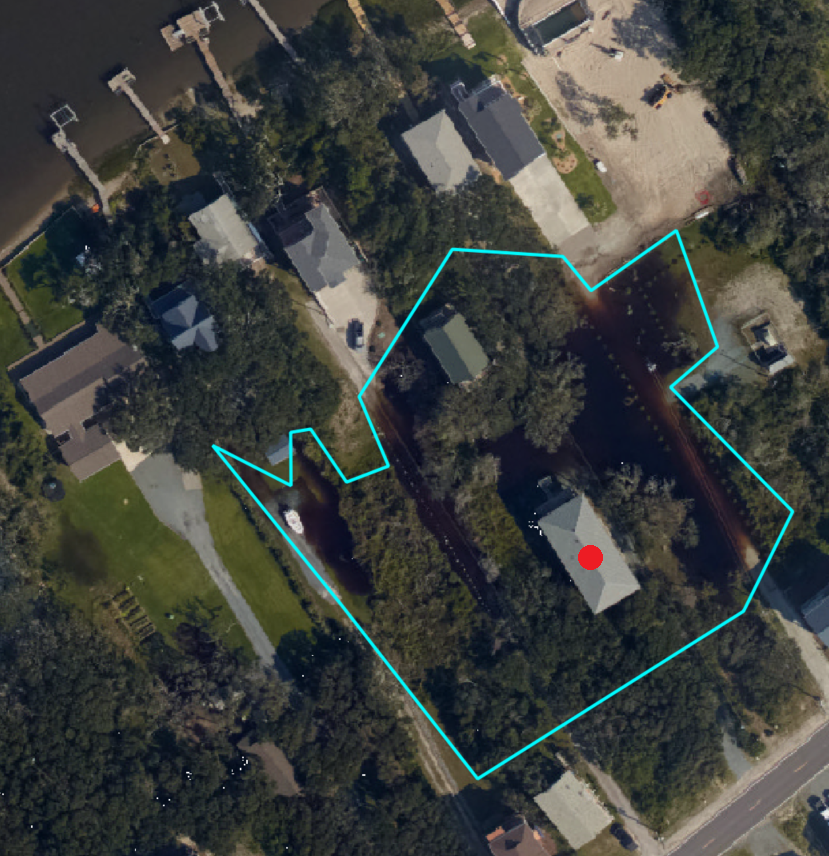
454 N Anderson Blvd, Holly Ridge, NC 28445
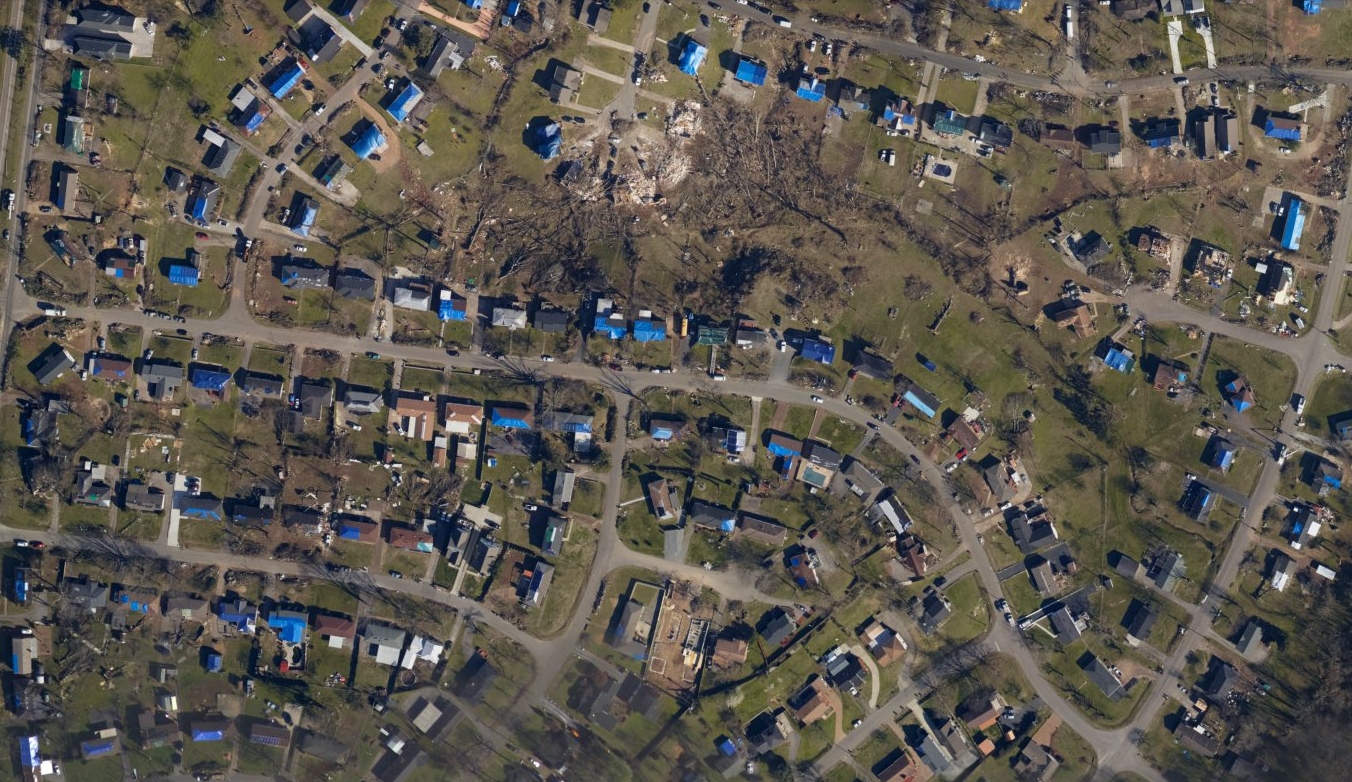
A neighborhood view, with multiple buildings potentially flooded:
24 Be Be Ln, Ocracoke, NC 27960
A commercial area with adjacent flooding - even without being surrounded on multiple sides by water, these buildings are likely to have experienced some flood damage:
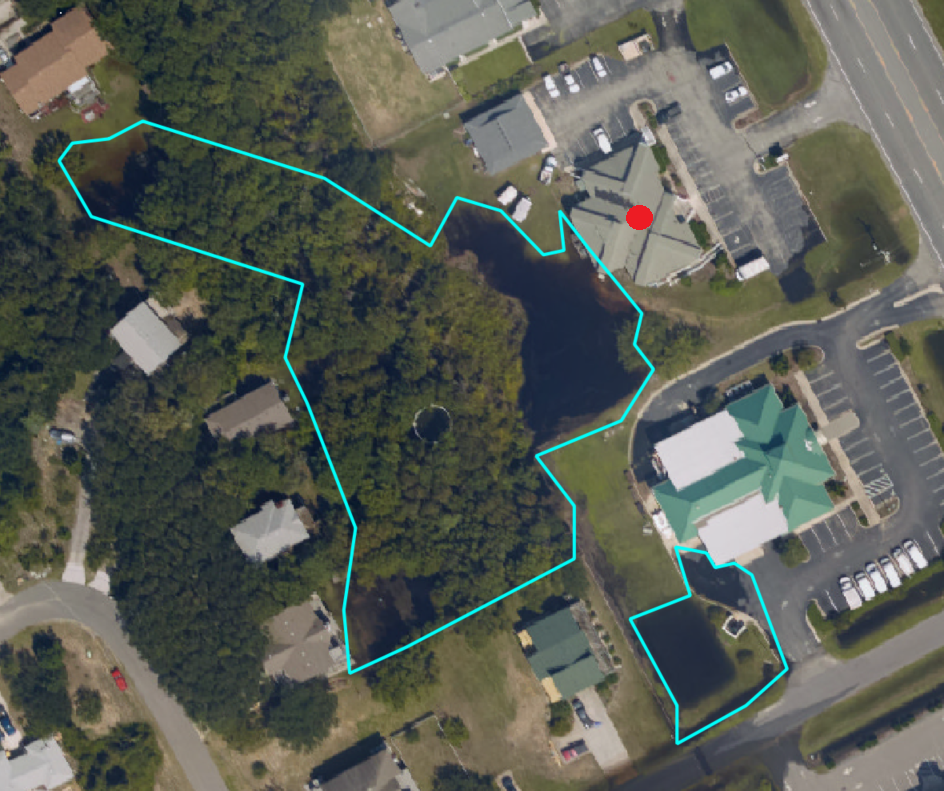
3608 N Croatan Hwy, Kitty Hawk, NC 27949
This is very similar to the work CrowdAI did after Hurricane Michael and for a multinational insurance company after floods in Western Europe in 2018.
At CrowdAI, we are committed as a team to build technology that is used to make the world a better place. In keeping with that commitment, we will be open-sourcing the dataset we created for flooded roads and buildings in North Carolina and will share the data with relevant NGO and government stakeholders. A note about our dataset: we began this process by using our image segmentation models to detect and classify the target features, then vectorized these results. Quality control checks were done on the vectorized data to ensure the results were accurate.
Dataset download details coming soon!